
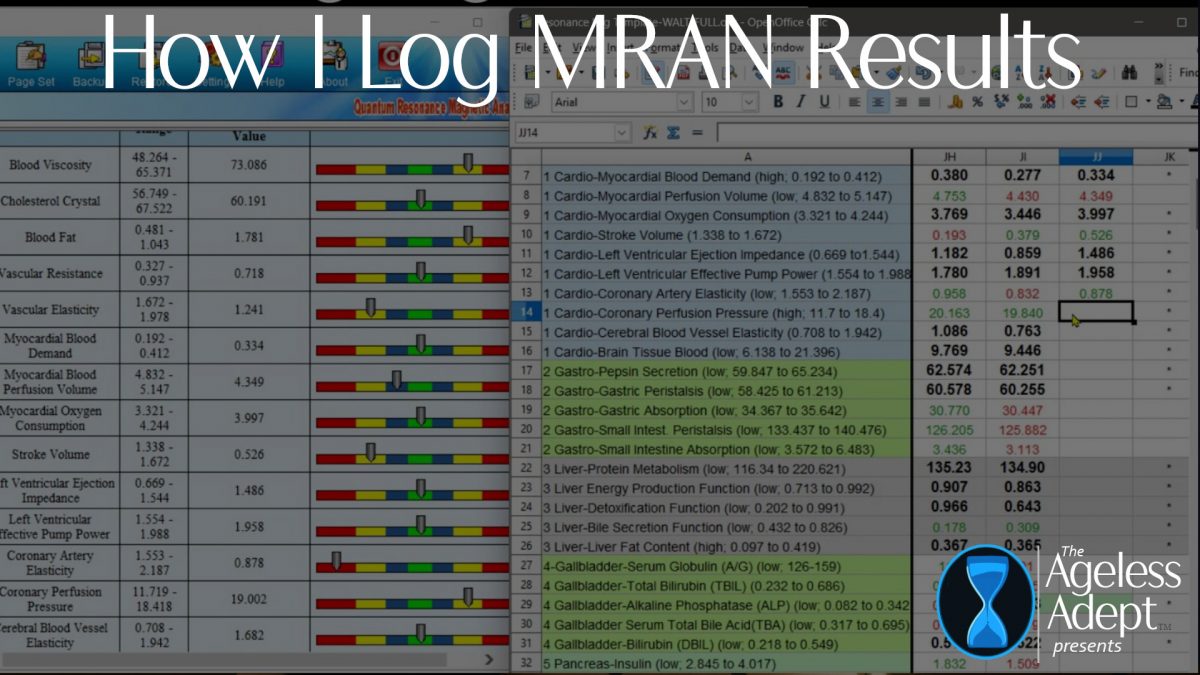
Quick Answer: Logging Magnetic Resonance Analyzer results in a structured spreadsheet helps track trends and visualize changes in organ and system health over time. Consistent recording improves insight and decision making.
I’ve provided a resonance log spreadsheet on the agelessadept.com website. Here’s a short demonstration of how I use it to record the daily readings from my Magnetic Resonance Analysis Device. I can then use the graph/chart feature to create a visual of the trend for the health of particular organs and/or systems.
Save $$$ on Products I Use (Click Image to View All)
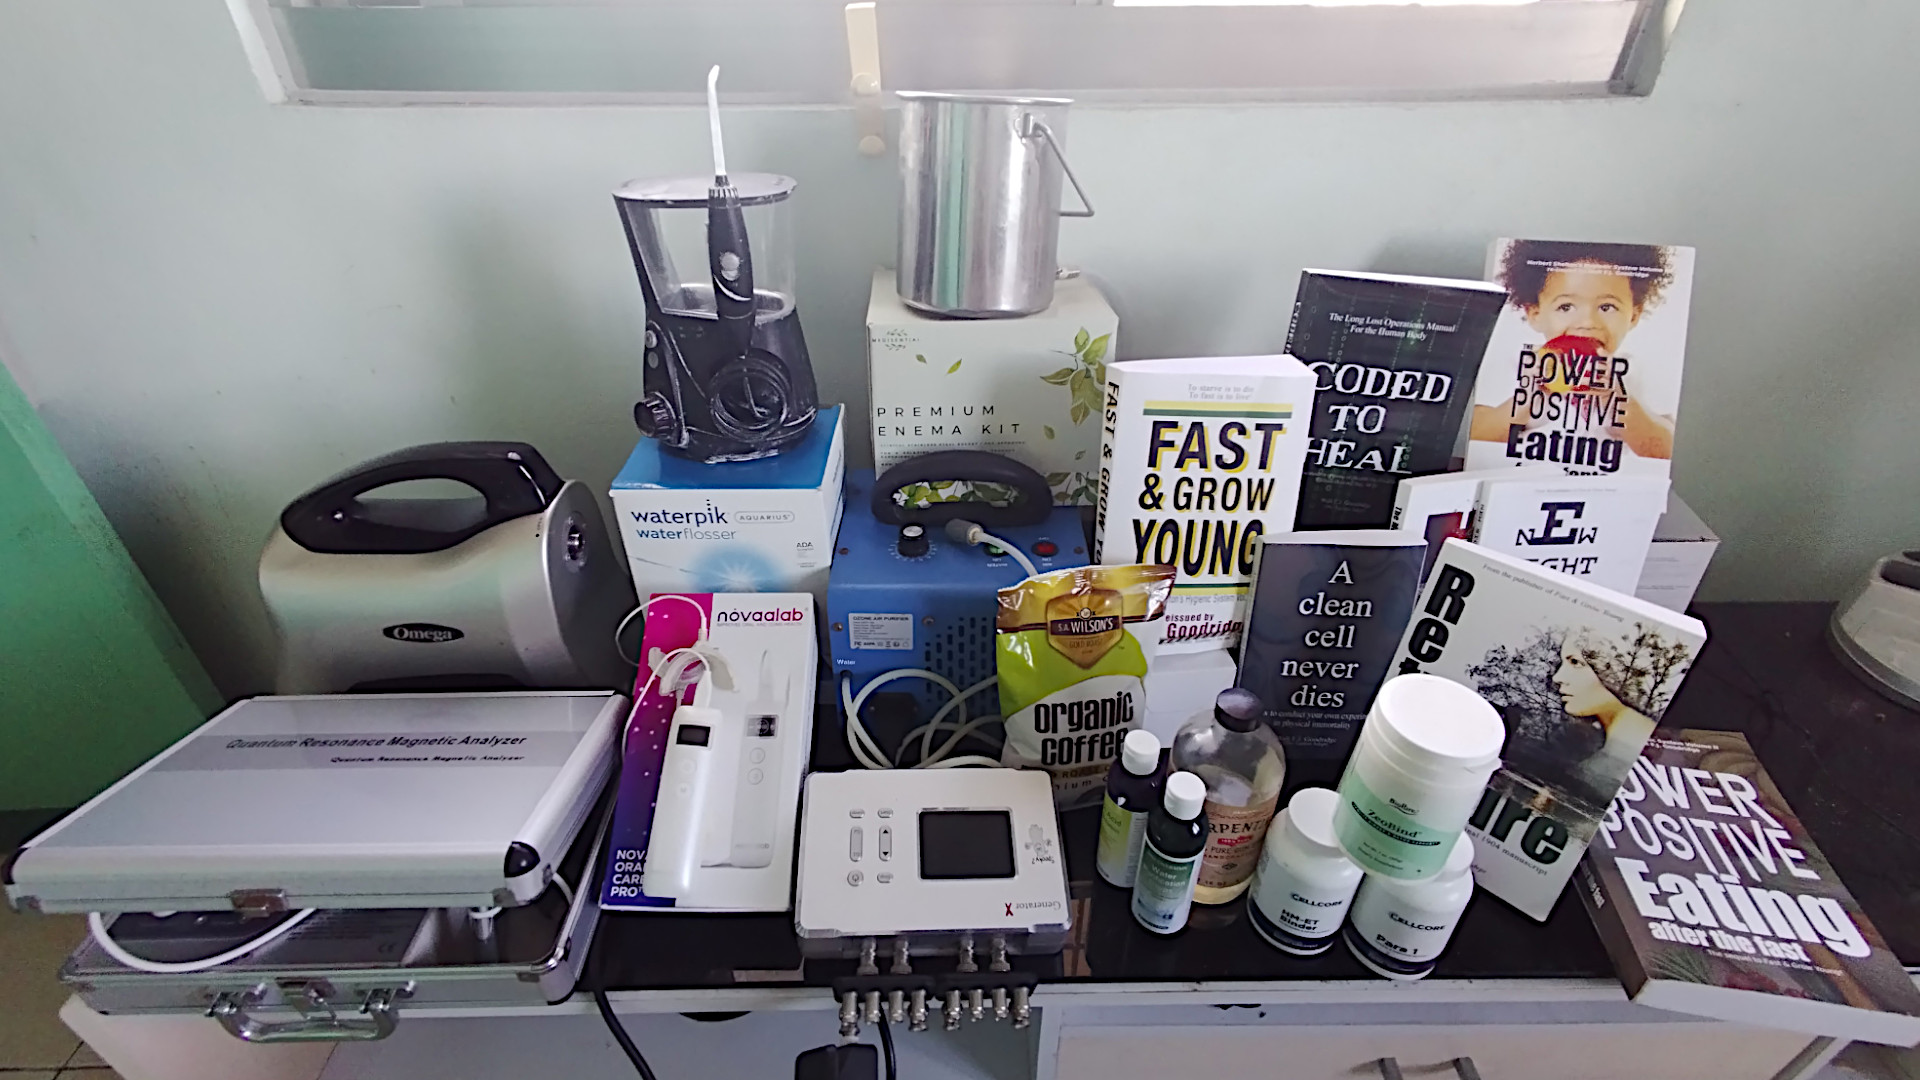
For discount coupon codes and direct links for some of unique health products I use, check out The Coupon Page —The Ageless Adept
***
-

Fast & Grow Young!
Price range: $6.49 through $16.95 Select options This product has multiple variants. The options may be chosen on the product page -

A Clean Cell Never Dies
Price range: $4.95 through $9.95 Select options This product has multiple variants. The options may be chosen on the product page -

The S.W.E.A.T Manifesto (FREE!)
Price range: $0.00 through $5.95 Select options This product has multiple variants. The options may be chosen on the product page
Frequently Asked Questions
Why log MRAN results daily?
Daily tracking helps identify patterns and long term trends that single readings cannot show.
What tools should I use?
A spreadsheet with chart features allows easy visualization of changes over time.
How do graphs help?
Graphs highlight trends and make it easier to see improvements or declines across systems.
A.I. Disclaimer
Please note that the AI-generated responses to my health-related questions are often slightly customized based on
a special prompt
that includes my stated preferences for natural remedies, vegan-friendly products and protocols, alternative therapies,
Traditional Chinese Medicine, and my personal medical history.
I encourage you to begin your own dialogue with AI to tailor recommendations to your specific needs. —The Ageless Adept
I encourage you to begin your own dialogue with AI to tailor recommendations to your specific needs. —The Ageless Adept


